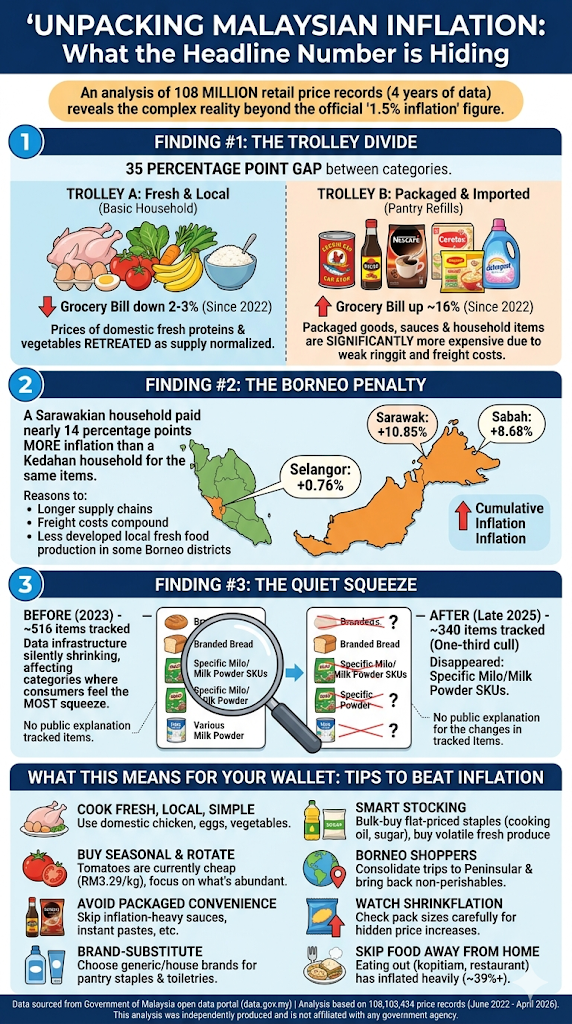
An analysis of 108 million Malaysian retail price records reveals three things the headline inflation number is hiding from you. (while the 108 million sounds impressives, it’s actually what 4 years of price tracking for hundreds of products over thousands of stores get)
The two trolleys
Two people walk into the same Lotus’s in Subang Jaya on a Saturday morning. They each spend exactly RM200. They walk out roughly satisfied with their shop.
Trolley A contains: a whole chicken, a tray of 30 eggs, two kilos of vegetables, a bag of fish, some bananas, a bag of local rice, a kilo of cooking oil. Basic Malaysian household stuff.
Trolley B contains: a tin of Sardin Cap Ayam, a bottle of kicap, a packet of Nescafe Classic, a tin of Cerelac for the toddler, a few packets of Maggi, a tub of Quaker Oats, two cans of Santan Kara, a packet of Adabi curry powder, a tube of Colgate, a box of Attack detergent. Pantry-and-toiletries refill stuff.
Both trolleys cost RM200 today. In June 2022, the same trolleys would have cost RM205 and RM172 respectively.
The first person — Trolley A — walked out today paying less than they would have nearly four years ago. Their grocery bill has actually gone down by about 2-3%.
The second person — Trolley B — walked out today paying about 16% more than they would have in 2022. Their wallet feels the inflation Malaysians keep complaining about.
Same shop. Same day. Same total spend. Two completely different inflation experiences.
This is what the official “Malaysia inflation rate is 1.5%” headline number hides. There is no single Malaysian inflation rate. There are at least two — and which one you live under depends almost entirely on what you put in your trolley.
What this article is, and isn’t
Over the past few weeks I downloaded every single price record published by Malaysia’s federal price-tracking system since June 2022 — that’s 108,103,434 observations across 2,719 supermarkets, hypermarkets, wet markets, and convenience stores nationwide, covering 602 distinct grocery items.
I built a real, weighted price index — what economists call a Laspeyres-style consumer price index, the same general approach used by central banks worldwide. I designed a 40-item basket calibrated to the actual spending shares of Malaysian households, ran it through the data, stress-tested it five different ways, and compared the results to the government’s official numbers.
What I found does not support the simple narrative that the government is hiding the truth about inflation. The official Department of Statistics CPI numbers are roughly correct, in aggregate.
What I found is something more interesting: the aggregate inflation number is misleading not because it’s wrong, but because almost no Malaysian household actually experiences “average” inflation. The variance hidden inside the headline number is enormous, and it splits Malaysians into winners and losers in ways that are not random — they break along lines of income, geography, life stage, and grocery habit.
Three findings emerged from the data that I think every Malaysian should understand. They will change how you think about your grocery bill, how you stretch your ringgit, and possibly how you vote.
I’ll show you the numbers. You decide.
Finding #1: The Trolley Divide
Here is the headline finding, expressed as plainly as I can:
Between June 2022 and April 2026, fresh proteins and vegetables in Malaysia got cheaper. Packaged foods, sauces, and household goods got significantly more expensive. The gap between these two trajectories is over 35 percentage points.
Let me put numbers on every category in our 40-item basket, so you can find your own habits in the data:
| Category | What it includes | Price change since June 2022 |
|---|---|---|
| Coconut & santan | Kelapa biji, Santan Kara | +34.5% |
| Fruit | Pisang Berangan, limau nipis | +22.9% |
| Sauces & condiments | Sardin, kicap, sos tomato, kari powder | +19.8% |
| Baby & dairy | Cerelac, Dutch Lady susu tepung | +13.7% |
| Grains | Beras 10kg, tepung, mee kuning | +13.2% |
| Household products | Detergent, toothpaste | +12.5% |
| Pantry & breakfast | Maggi, milk powder, Nescafe, Quaker Oats, Teh Boh | +10.0% |
| Cooking essentials | Cooking oil, sugar, salt, ghee | +4.3% |
| Aromatics | Onion, garlic | +2.9% |
| Vegetables (fresh) | Sawi, kangkung, tomato, carrot, ginger, timun | −8.0% |
| Proteins | Chicken, eggs, ikan kembung | −7.3% |
Now translate that into actual Malaysians.
A young KL professional cooking simple meals at home — buying weekly chicken breast, a tray of eggs, vegetables, some bananas, the occasional fish — is paying less in 2026 than they did in 2022. For them, the “cost of living crisis” is largely a non-event at the grocery counter. They might even feel slightly smug.
A mother of three in Cheras buying instant baby cereal, milk powder, packaged snacks, school-lunch sauces, household toiletries, and the same proteins and vegetables — is paying maybe 8-12% more. She feels it. She talks about it. She isn’t imagining it.
An older auntie in Kelantan cooking traditional Malay meals heavy on santan, freshly grated coconut, dried fish, sambal-style sauces, and rice — is paying maybe 15-20% more on her ingredients. The traditional Malaysian kitchen has been hit harder than the Westernised one.
The macro-level “inflation is 1.5%” number is technically true, in the sense that if you averaged Malaysia’s grocery basket the way the official methodology averages it, you get around there. But that number describes a statistical Malaysian household, not any actual one. Real households have specific habits, and those habits sort them into very different inflation experiences.
Why packaged goods went up while fresh food went down
The mechanism is worth understanding because it tells you what to expect going forward.
Fresh foods are mostly produced domestically. Malaysian farms grow the chickens, lay the eggs, raise the vegetables. When global supply chains went haywire in 2022, fresh-food prices spiked here too — but as production normalised in 2023-24, prices retreated. The data shows tomato prices in particular collapsing by nearly 50% from RM6.49/kg in June 2022 to RM3.29/kg by April 2026. That’s a story of supply normalisation, not market manipulation.
Packaged foods are mostly imported, or use imported inputs. Sardin from Thailand. Adabi curry powder using imported spices. Cerelac processed in regional facilities. Nescafe with imported coffee beans. Santan Kara with Thai coconut. Detergent with imported chemicals. All of these get hit by a triple punch: weak ringgit (which never recovered to pre-2022 strength), elevated freight costs that proved sticky, and global commodity inflation in their input ingredients.
The result is a structural divergence. Fresh, local, perishable food: tracks domestic supply, has come back down. Packaged, imported or import-heavy goods: tracks ringgit and global supply chains, has stayed elevated.
Going forward, this means: if you want to insulate yourself from inflation, the data is unambiguous about how. Cook from scratch using fresh, local ingredients. Skip the packaged convenience products. The traditional kitchen of forty years ago is, paradoxically, the inflation-proof kitchen of today.
What RM100 buys you, then and now
Take a real grocery list a Malaysian household might pick up on a typical Saturday and price it at June 2022 levels versus April 2026 levels:
| Item | June 2022 | April 2026 | Change |
|---|---|---|---|
| 1kg whole chicken | RM 8.90 | RM 8.29 | −7% |
| 1kg chicken breast | RM 14.90 | RM 13.50 | −9% |
| 30 eggs (Grade A) | RM 12.90 | RM 12.49 | −3% |
| 1kg ikan kembung | RM 10.50 | RM 10.99 | +5% |
| 1kg sawi hijau | RM 5.50 | RM 4.99 | −9% |
| 1kg tomato | RM 6.49 | RM 3.29 | −49% |
| 1kg Pisang Berangan | RM 5.45 | RM 6.99 | +28% |
| 10kg local rice | RM 29.00 | RM 36.00 | +24% |
| 1kg cooking oil paket | RM 2.50 | RM 2.50 | 0% |
| 1kg sugar | RM 2.85 | RM 2.85 | 0% |
| Tin of Sardin Cap Ayam | RM 9.00 | RM 10.45 | +16% |
| 200ml Santan Kara | RM 3.10 | RM 4.00 | +29% |
| Adabi kicap manis 340ml | RM 5.20 | RM 5.95 | +14% |
| 200g Nescafe Classic | RM 18.80 | RM 23.80 | +27% |
| 600g Dutch Lady susu | RM 19.50 | RM 22.50 | +15% |
| 500g Cerelac beras | RM 14.50 | RM 17.40 | +20% |
| Maggi Mi Kari 5x79g | RM 5.20 | RM 5.95 | +14% |
| 800g Attack detergent | RM 11.50 | RM 13.20 | +15% |
| Colgate toothpaste 250g | RM 8.50 | RM 9.50 | +12% |
Look at what stayed flat: subsidised staples (cooking oil paket, sugar, salt). Look at what fell: domestic fresh food. Look at what rose: anything packaged, imported, or branded.
This is the trolley divide. It’s not subtle once you see it.
Finding #2: The Borneo Penalty
If the Trolley Divide is the universal Malaysian story, the Borneo Penalty is the regional one — and it’s where the headline inflation number genuinely understates reality for a specific group of Malaysians.
When I broke the data down by state, the geographic spread was stark:
| State | Cumulative grocery inflation since June 2022 |
|---|---|
| Sarawak | +10.85% |
| Sabah | +8.68% |
| W.P. Labuan | +3.96% |
| Perlis | +3.82% |
| W.P. Putrajaya | +2.56% |
| W.P. Kuala Lumpur | +2.48% |
| Pulau Pinang | +1.68% |
| Perak | +1.52% |
| Terengganu | +1.37% |
| Selangor | +0.76% |
| Melaka | −0.07% |
| Kelantan | −0.22% |
| Pahang | −0.53% |
| Johor | −1.34% |
| Negeri Sembilan | −2.05% |
| Kedah | −3.11% |
A Sarawakian household and a Kedahan household, buying identical products, lived through inflation experiences nearly 14 percentage points apart over four years.
That is not a small number. That is the difference between a comfortable family budget and a stressed one. Across nearly four years and two-and-a-half million households in Sarawak alone, that gap aggregates into billions of ringgit of differential cost-of-living burden — disproportionately borne by the citizens furthest from the country’s political and commercial centres.
There are obvious structural reasons. Borneo’s grocery supply chains are longer. Most packaged goods sold in Sabah and Sarawak are shipped or flown in from Peninsular Malaysia; freight costs compound at every step. Shelf-pricing reflects this. Local production of fresh food is also less developed in some Borneo districts than in mature peninsular agricultural states like Cameron Highlands or Pahang’s vegetable belt, so the deflationary benefit of domestic fresh-food production reaches Borneo less powerfully.
What’s striking is how quietly this disparity persists. There is no national conversation about it. The official inflation number lumps Sarawak in with Selangor and reports a single figure. State-level CPI is published, but it isn’t the lead in any news story. Most Sarawakians I’ve spoken to over the years know they pay more — they don’t know they’ve been paying disproportionately more inflation, year after year, with no political response.
Part of the reason this stays invisible is simple media geography. Most national journalism is written in Klang Valley, where grocery inflation has been close to zero. Reporters who shop at the Mont Kiara Village Grocer or the Bangsar Jaya Grocer literally do not see the inflation that exists 1,500 kilometres east, because their own trolleys haven’t moved much in price.
If you live in Sarawak or Sabah and you’ve been feeling that the official inflation numbers don’t match your reality — you’re not crazy, you’re not exaggerating, and you’re not bad at maths. You really do live in a different inflation regime than people in Kuala Lumpur, by a wide and consistent margin. The numbers prove it.
The flip side is just as worth knowing. Kedah, Negeri Sembilan, Johor, and Pahang have actually seen mild grocery deflation since 2022. A household in Sungai Petani that’s been quietly grumbling about rising costs is — at least at the grocery counter — wrong. Their petrol, electricity, road tax, school fees, and rent may have risen. Their groceries on the whole have not. That, too, is a useful thing to know about your own life.
Finding #3: The Quiet Squeeze
This is the most uncomfortable finding, and the one that might actually move Malaysian policy — but only if enough people see it.
In July and August 2025, the federal price-tracking system underwent a significant, mostly unannounced restructuring. The number of items being publicly tracked dropped from approximately 516 to around 340 — a one-third cull. New items were added; many old items disappeared.
What disappeared?
Bread products — including all branded loaves like Gardenia and Massimo — vanished from the tracked list. Several Milo SKUs disappeared. Specific milk powder variants. Many branded sauces. Some popular instant noodle pack sizes.
I want to be careful here, because the explanation might be entirely benign. KPDN told stakeholders the restructuring was about modernising data collection (including new automated feeds from Mydin and Redtick), focusing on items that better reflect contemporary spending, and removing redundancy. Those are reasonable things. Branded bread is also separately price-controlled under Malaysia’s Akta Kawalan Harga, so its price barely moves anyway, which makes it less informative for tracking inflation.
But here’s the thing. Several of the categories that have inflated the most aggressively in our data are precisely the ones where post-restructuring tracking has become thinner. And there’s no public explanation, no parliamentary discussion, no journalism, and no public methodology document explaining which items were dropped, why, and what the impact on the published inflation series might be.
When I tried to verify whether substitute products (a different brand of bread, a different milk powder size, a different Milo packet) had survived the restructuring — most of them hadn’t. The cull was systematic, not random. It targeted specific product subcategories.
I am not claiming this was deliberate manipulation. I have no evidence of that. What I can say with confidence:
- The product set being tracked today is meaningfully smaller and different from what was being tracked in 2023.
- No public technical document explains the changes in detail.
- The categories that were most affected by the cull include several that, in the categories that remain tracked, show high inflation.
- This means anyone publishing a “national grocery price index” in late 2026 — including this article — is necessarily working with a slightly different basket than they would have been three years ago.
In the world of inflation measurement, this is called basket continuity risk. Every statistical agency in every country deals with it. The standard practice is transparent disclosure: when a basket is updated, the agency publishes exactly what changed, why, and provides bridge calculations so analysts can compare apples to apples across the break. KPDN has not done this publicly for its open dataset, as far as I can find.
The outcome is that the Malaysian public is increasingly relying on a data series whose composition is changing, without being told how. We are flying with one fewer instrument than we had three years ago, and nobody has announced it from the cockpit.
The journalist Chua Sue-Ann or any of her colleagues at The Edge would write this story differently than I am. They would call KPDN’s spokesperson, get a comment, possibly get told it’s all fine, and write a balanced piece. I am not a journalist; I am a guy with a parquet file and DuckDB. So I will say only what the data shows: Malaysia’s price transparency infrastructure has gotten visibly thinner over the past year, in ways that affect exactly the categories where consumers feel the most squeeze. Make of that what you will.
So how high is grocery inflation, really?
Let me give you my best honest answer, because I owe you that after dragging you through four years of data.
For groceries, narrowly defined, properly weighted to a typical Malaysian household: about 7% cumulative inflation since June 2022, or roughly 1.8% per year. That is what my Lauk-Pauk Index, weighted by realistic Malaysian household spending shares, produces. It is in the same neighbourhood as the official DOSM Food CPI, which sits at 13-14% but covers a broader and differently-weighted basket including food consumed away from home (which my analysis excludes because PriceCatcher doesn’t track restaurant prices).
For the categories that hurt most — sauces, packaged foods, baby items, dairy, household goods — inflation is closer to 15-20% cumulative. That’s the part of the experience that lives in your memory. Your brain doesn’t average tomato prices against santan prices. It remembers the santan tin going from RM3.10 to RM4.00 because that hurt, and forgets the tomato falling from RM6.49 to RM3.29 because that didn’t.
For Sarawakians and Sabahans, even basic grocery inflation has been 9-11% cumulative. The Borneo Penalty is real and persistent.
For things outside our basket entirely — restaurant meals, takeaway food, transport, education, healthcare, rent — actual inflation is almost certainly higher. A teh tarik that cost RM1.80 in 2022 now routinely costs RM2.50 at neighbourhood kopitiams, a 39% rise in four years. This is invisible in the PriceCatcher data because shelf-prices for groceries don’t capture it. But it’s how most Malaysians actually experience the cost of living.
The honest summary: the official inflation number is statistically defensible but psychologically misleading. It hides a 35-point divergence between food categories. It averages a 14-point regional spread into a single figure. It doesn’t capture the eating-out inflation that dominates many Malaysians’ food spending. And it relies on a data infrastructure that is silently shrinking.
You are not wrong to feel that things have gotten more expensive. The data confirms it — in specific places, for specific products, for specific people. The averaging is what makes the truth seem invisible.
What this means for your wallet
If you’ve read this far, you deserve actionable advice rather than just analysis. Based on what the data actually shows about Malaysian price dynamics over four years, here is the most concrete grocery-saving guidance I can give:
1. Cook fresh, local, simple food. This is the single biggest leverage point. Fresh chicken, eggs, fish, vegetables, and fruits sourced domestically have either deflated or stayed flat. Every meal you cook from these ingredients rather than from packets is a meal that has effectively become cheaper since 2022. The traditional Malaysian kitchen — heavy on fresh ikan, sayur, ayam kampung, and rice — is the genuine inflation-proof kitchen.
2. Buy seasonal and rotate. Tomatoes are dirt cheap right now (RM3.29/kg, half their 2022 price). Cili padi at RM25/kg is expensive but stable; buy in bulk and freeze when there’s a sale. Pisang Berangan at RM6.99/kg is up 28%; switch to other local fruits when berangan is high. The data shows enormous swings in fresh produce — paying attention saves real money.
3. Beware the packaged trap. Every time you replace a fresh ingredient with a packaged convenience version — bottled santan instead of grated coconut, instant curry paste instead of dry-spice blend, sardin in tomato sauce instead of fresh ikan — you’re paying inflation that fresh ingredients are not. Convenience is real and worth something, but the data shows it’s becoming pricier convenience over time.
4. Brand-substitute where you can. Within most packaged categories, our data shows wide variation between brand prices. A Tamin or Cap Kipas Udang kicap is structurally cheaper than premium brands and inflated less. Generic and house-brand versions of detergents, oats, milk powders, and sauces almost always inflated less than their branded equivalents over this period.
5. Buy in bulk where prices are stable; weekly where prices are volatile. Subsidised staples (cooking oil paket, sugar, rice) are flat or near-flat — bulk-buy them. Fresh produce is highly volatile — buy only what you’ll cook in a week. Many households make the opposite choice (running to the shop for sugar, stocking up on vegetables) which is exactly backwards.
6. If you live in Borneo, consolidate trips. Sabah and Sarawak shoppers pay more per item but the differential is biggest on packaged imported goods. When you visit Peninsular Malaysia for any reason — work, family, holiday — bring back non-perishable packaged goods. The 8-10% Borneo Penalty on those items often makes round-trip cargo cheaper than local purchase.
7. Watch for shrinkflation. This article doesn’t capture it, but informal observation across Malaysian shelves suggests pack sizes have quietly shrunk on many products. Your Maggi seasoning might still cost the same RM1.20, but check whether it’s gone from 8g to 7g. The price stayed the same; the inflation hid in the gram count.
8. Skip food away from home where you can. The single biggest concealed inflation in Malaysian middle-class life over the past four years is restaurant and kopitiam food. A nasi campur lunch that was RM8 in 2022 is RM12 now. That 50% rise dwarfs anything on the supermarket shelf. Cooking at home is, calorie-for-calorie, the most powerful anti-inflation lever you have.
A note on methodology
For anyone who wants to scrutinise the work — and I hope someone does — here’s exactly how the analysis was constructed:
Data source: The Malaysian federal government’s open price-tracking dataset, published monthly under the Creative Commons Attribution 4.0 license at data.gov.my. Coverage: 108,103,434 individual price observations between June 2022 and April 2026. Premises tracked: 2,719 supermarkets, hypermarkets, wet markets, and convenience stores nationally. Items tracked across the period: 602.
Basket construction: I built a 40-item basket spanning 11 categories that I consider representative of typical Malaysian household grocery spending. Item selection was constrained to items with full data coverage across all 47 complete months in the period (June 2022 through April 2026; May 2026 was excluded as a partial month).
Index methodology: Two parallel indexes were computed — equal-weighted (each item contributes 1/40th to the index) and expenditure-weighted (each item weighted by its category’s estimated share of household grocery spending, calibrated against published Department of Statistics CPI sub-group structure and Household Expenditure Survey 2022 reports). Both produce a number around +7% cumulative for the period; the expenditure-weighted version is reported as the headline because it better reflects actual household experience.
Same-store stress test: To rule out composition bias from changes in the surveyed-premises mix over time, the index was re-run restricting only to premises that reported data in both June 2022 and April 2026. Results were within 1 percentage point of the full-sample numbers, confirming the headline is not an artifact of premise turnover.
State-level analysis: State-level inflation was computed by re-running the same index per state, requiring at least 15 of the 40 basket items to have June 2022 baseline coverage in that state. All 16 states/federal territories met that threshold.
Limitations: The dataset captures shelf prices, not transaction prices — so it cannot detect promotional discounts, loyalty programme savings, or shrinkflation. It does not include food consumed away from home, services, transport, education, healthcare, rent, or utilities, all of which contribute to overall cost-of-living changes that this analysis cannot speak to. PriceCatcher’s coverage of rural Sabah and Sarawak is thinner than its coverage of Klang Valley, so Borneo state-level numbers are computed on a smaller observation base than peninsular states.
Data and code: The full analysis, including the 40-item basket definition, weighting structure, and reproduction code, is available on request. Anyone with basic Python and DuckDB can reproduce these findings against the original published dataset. I encourage that reproduction; if anything in my analysis is wrong, I want to be corrected.
Source attribution: Underlying data sourced from the Government of Malaysia’s open data portal (data.gov.my) and used under Creative Commons Attribution 4.0 International License.
Final thoughts
The most useful thing I can leave you with is a different mental model than the one most Malaysians carry around about inflation.
The headline inflation rate is not lying to you, and it is not telling you the truth. It is averaging your country into a number that no actual citizen experiences. It hides — by design, not by malice — the fact that your specific grocery habits, your specific state of residence, your specific life stage, and your specific income level all sort you into vastly different price universes.
A young single in KL eating mostly fresh food has lived through near-zero grocery inflation since 2022. A young family in Kota Kinabalu buying packaged baby items, dairy, and toiletries has lived through 12-15% grocery inflation. They are both Malaysians; the official statistics report a single number for both.
This is not a uniquely Malaysian problem. Every country in the world publishes inflation statistics that mask huge variance. But Malaysians, more than most, live in a country where the variance is itself the story — between Borneo and Peninsula, between fresh and packaged, between what gets subsidised and what doesn’t. The aggregate number is the least interesting part of Malaysian inflation. The variance is the whole story.
If this article has done one thing, I hope it has shown you that the official numbers are not adversaries to be debunked, but tools to be read carefully. They are correct. They are also incomplete. They tell you the average; they do not tell you yours.
Find yours by paying attention to your trolley starting today.
This analysis was independently produced. It is not affiliated with the Department of Statistics Malaysia, the Ministry of Domestic Trade and Cost of Living, or any government agency. All errors and interpretations are my own.